Prometheus and Grafana
When the application is deployed to production , it is always necessary to monitor, monitor, and track system information ( Logs, CPU, RAM, disks, IO operations,... ) to determine the times and periods of impact. negatively affect the performance of the application. The purpose is to ensure that the application always operates stably.
Prometheus
Prometheus is used to monitor the system through pre-installed daemons on nodes, thereby collecting necessary information. Prometheus communicates with the node via http/https protocoland stores data in a time-series database (TSDB).
Time series databases (TSDB) are databases that are stored according to timelines. This means that each data is always associated with a certain time point, thereby creating a time series of data, thereby allowing us to review data for a period of 1 hour or 1 hour.
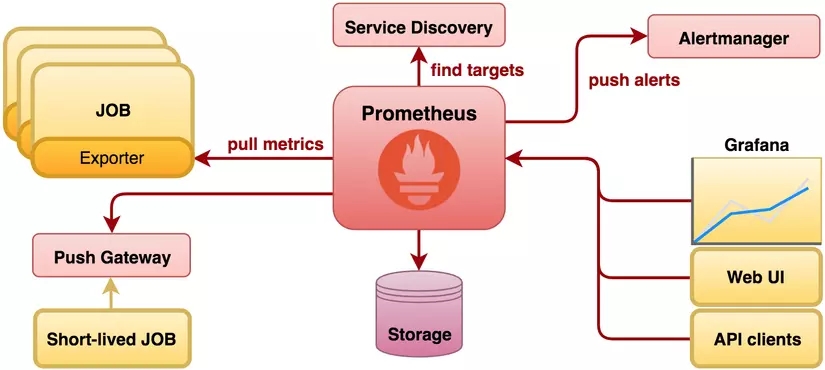
Prometheus activities
Prometheus will perform the process of pulling parameters/metrics from jobs (exporters).
Prometheus will store the collected data on the local server.
Prometheus will run rules to process data as needed as well as check and implement the alerts you want.
1.2 Grafana
Grafana is a vizualizer that displays metrics as charts or graphs, assembled into a highly customizable dashboard, making it easy to monitor node health. Simply for you to understand, after getting the metrics from the devices, grafana will use that metric to analyze and create a dashboard that visually depicts the metrics necessary for monitoring such as CPU , RAM , disks , IO. operations...

Last updated